 CAD tip # 8479:
Question
 AutoCAD 3D surfaces can be created also parametrically - generated automatically using a math expression (equation). For this you can use the free application CADstudio 3DPlot.
In your current DWG drawing, 3DPlot generates a 3D surface of the type polyface mesh by applying your custom defined expression, entered as [X,Y,Z] = f(U,V). So you can generate eny mathematic surfaces. The 3DPLOT command contains several sample objects.
To use your own math functions (after you load 3DPlot), you need to perform two steps:
- define your function;
- call the tool (3DPlot) to plot it.
For an example, a 3D surface defined by the expression Z = sin (2 * x * y) will need these two steps in the following form - enter the LISP commands in your AutoCAD command line:
(defun mySaddle (x y) (list x y (sin (* 2 x y))))
(3DPlot mySaddle -1.0 1.0 0.1 -1.0 1.0 0.1)
The first line defines your math expression to a LISP function "mySaddle" (must return a list of coordinates X Y Z). The second line then calls the plot engine for points in the interval (-1;1) in both directions, in a step of 0.1. The result will be a nice 3D "saddle".

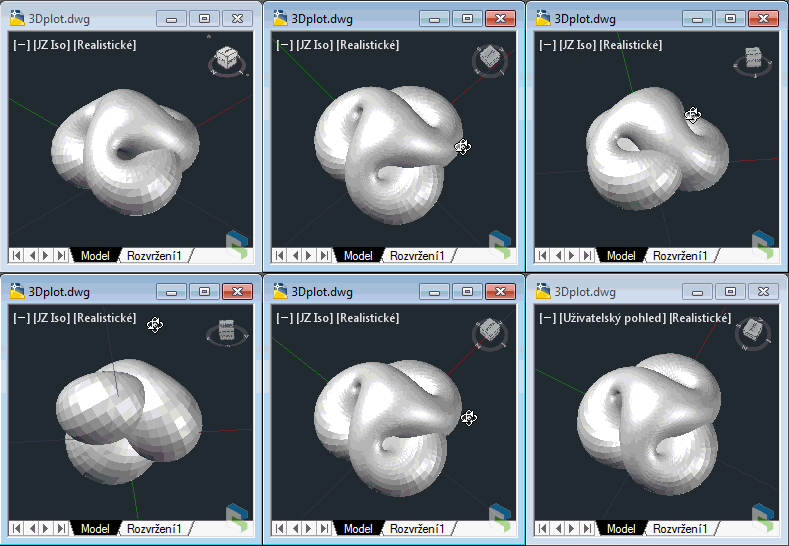
The top right image in the DWG format - see Boy surface.
See more information and download on CADstudio 3DPlot
![CAD Forum - tips, tricks, discussion and utilities for AutoCAD, Inventor, Revit and other Autodesk products [www.cadforum.cz] CAD Forum - tips, tricks, discussion and utilities for AutoCAD, Inventor, Revit and other Autodesk products [www.cadforum.cz]](../common/arkance_186.png)


