Over 1.110.000 registered users (EN+CZ).
AutoCAD tips, Inventor tips, Revit tips, Civil tips, Fusion tips.
Try the updated section Converters and online CAD tools,
new AutoCAD 2026 commands and environment variables.
 CAD tip # 8884:
Question
A
 With the free utility CADstudio 2DPlot you can easily use your AutoCAD to generate 2D curve from any mathematical function (XY) - ie. create a curve (2D polyline) representing results of the function. The function has to be defined as XY=f(U) - i.e. returning a (X Y) list as a result of one variable parameter.
On the homepage of 2DPlot you can find several examples of definitions of mathematical functions and specifying intervals of input values and precision of the resulting curve.
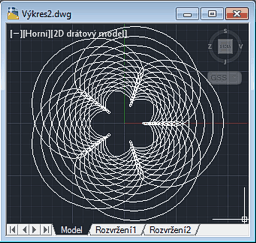
With parametrization you can use 2DPlot also for creating guilloches, strophoids, curves based on the hypotrochoide and epitrochoide functions, resp. on Farrel wheels.
General format of 2DPlot calls:
(2dplot fXY u-from u-to ustep)
Example - sinusoide (from -PI to PI, 100 steps):
(defun fSin(u)(list u (sin u)))
(2DPlot fSin (- pi) pi (/ (* 2 pi) 100))
or a parabolic curve (from -2 to 2, 200 steps):
(defun fParabola(u)(list u (* u u)))
(2DPlot fParabola -2.0 2.0 (/ 4.0 200))
The interactive command 2DPLOT offers several samples (sinusoid, catenary...). You can use the job #8) for interesting parametric Farrel wheel curves.
You can use 2DPlot as a replacement of the old tool FPLOT.LSP.
ACAD
28.10.2012
15736×
this tip shared by ARKANCE experts applies to: AutoCAD ·
![CAD Forum - tips, tricks, discussion and utilities for AutoCAD, Inventor, Revit and other Autodesk products [www.cadforum.cz] CAD Forum - tips, tricks, discussion and utilities for AutoCAD, Inventor, Revit and other Autodesk products [www.cadforum.cz]](../common/arkance_186.png)


